Creating Metabolic Harmony with Hormones
Signs & Symptoms of Estrogen and Progesterone Imbalances in Aging Females
In Functional Medicine, hormonal imbalances are assessed through patterns of symptoms, blood, urine, and saliva testing, as well as metabolic and detoxification markers. Here’s a breakdown of how low vs. high estrogen and low vs. high progesterone manifest in aging women, especially during perimenopause and menopause.
Low Estrogen (Estrogen Deficiency)
Common in: Perimenopause & Menopause (Ovarian function declines)
Signs & Symptoms:
✅ Metabolic & Weight Changes
- Increased visceral fat (belly fat)
- Difficulty maintaining lean muscle mass (estrogen supports muscle protein synthesis)
- Slower metabolism & lower energy levels
✅ Cognitive & Mood Issues
- Brain fog, memory lapses, difficulty concentrating
- Increased anxiety, depression, or mood swings
- Poor stress resilience (estrogen helps modulate cortisol response)
✅ Skin, Hair & Joint Health
- Dry skin, thinning hair, and brittle nails
- Loss of collagen & elasticity → more wrinkles and sagging skin
- Joint pain, stiffness, or increased injury risk
✅ Vaginal & Sexual Health
- Vaginal dryness, pain during intercourse (loss of estrogen reduces natural lubrication)
- Low libido or difficulty reaching orgasm
- Recurrent UTIs or bladder infections (due to thinning of vaginal & urethral tissues)
✅ Sleep & Hot Flashes
- Night sweats, hot flashes, chills
- Difficulty sleeping (estrogen supports melatonin production)
✅ Cardiovascular & Bone Health
- Increased LDL (“bad”) cholesterol, lower HDL (“good”) cholesterol
- Increased risk of osteoporosis (estrogen protects bones by regulating osteoclast activity)
Functional Medicine Approach:
- Optimize phytoestrogen intake (flaxseeds, fermented soy, legumes)
- Support liver detox (estrogen metabolism) → Cruciferous vegetables, DIM, sulforaphane
- Consider bioidentical estradiol replacement (if needed)
High Estrogen (Estrogen Dominance)
Common in: Perimenopause, Poor Estrogen Detoxification, Liver Congestion
Signs & Symptoms:
✅ Metabolic & Weight Gain
- Weight gain in hips, thighs, and belly
- Fluid retention & bloating
- Insulin resistance, blood sugar instability
✅ Mood & Mental Health
- Irritability, mood swings, or high anxiety
- Increased PMS symptoms (if still cycling)
- Brain fog, memory issues
✅ Breast & Menstrual Symptoms
- Breast tenderness, fibrocystic breasts
- Heavy or painful periods (if still cycling)
- Spotting between periods
✅ Thyroid & Fatigue Issues
- Sluggish thyroid function (estrogen affects thyroid hormone conversion)
- Fatigue, low motivation, and poor stress resilience
✅ Liver & Detox Issues
- Headaches, migraines
- Histamine intolerance, allergies, or sinus issues (estrogen stimulates histamine release)
Functional Medicine Approach:
- Support liver detox (glucuronidation, sulfation, methylation pathways) → DIM, calcium-D-glucarate, magnesium, B vitamins
- Reduce endocrine disruptors (plastics, parabens, BPA)
- Optimize gut health (poor gut function recirculates estrogens)
Low Progesterone (Estrogen Dominance Pattern)
Common in: Perimenopause, Chronic Stress, HPA Axis Dysfunction
Signs & Symptoms:
✅ Mood & Anxiety Issues
- Irritability, increased stress sensitivity
- Anxiety, panic attacks, or low stress tolerance
- Poor sleep quality (progesterone is calming & helps GABA production)
✅ Menstrual & Reproductive Symptoms (If still cycling)
- Irregular, heavy, or long periods
- Spotting before periods
- Increased PMS symptoms (cramps, bloating, breast tenderness)
✅ Sleep & Energy Issues
- Difficulty falling or staying asleep
- Fatigue, brain fog, or burnout symptoms
✅ Estrogen Dominance Symptoms (If paired with high estrogen)
- Weight gain in hips, thighs, and belly
- Water retention & bloating
Functional Medicine Approach:
- Reduce chronic stress (high cortisol depletes progesterone)
- Support adrenal health (vitamin C, B5, magnesium, adaptogens)
- Consider bioidentical progesterone cream (if appropriate)
High Progesterone (Rare)
Common in: Overuse of Bioidentical Progesterone, Luteal Phase Dysfunction
Signs & Symptoms:
✅ Fatigue & Low Energy
- Lethargy, drowsiness, feeling “too calm”
- Low motivation & sluggishness
✅ Dizziness & Blood Sugar Dysregulation
- Low blood pressure, dizziness, or lightheadedness
- Increased insulin resistance (if excessive progesterone use)
✅ Mood & Cognitive Effects
- Brain fog, forgetfulness, or slow thinking
- Depression or feeling emotionally “flat”
Functional Medicine Approach:
- Assess progesterone dosing (if supplementing)
- Ensure proper estrogen/progesterone balance
- Support adrenal health to regulate natural production
Summary: Key Differences
| Hormone | Low Symptoms | High Symptoms |
|---|---|---|
| Estrogen | Brain fog, hot flashes, vaginal dryness, low libido, osteoporosis, weight gain (belly) | Heavy periods, bloating, breast tenderness, mood swings, headaches, weight gain (hips/thighs) |
| Progesterone | Anxiety, insomnia, PMS, irregular periods, estrogen dominance | Fatigue, dizziness, sluggish thinking, insulin resistance |
Estrogen dominance can contribute to unexplained weight gain and low thyroid function through several interconnected mechanisms involving hormonal imbalances, metabolism, and inflammation.
Here’s how it works:
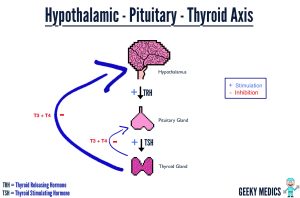
1. Estrogen Dominance & Thyroid Function
Estrogen dominance occurs when estrogen levels are too high relative to progesterone, either due to excess estrogen production, impaired detoxification, or low progesterone levels. This impacts the thyroid in multiple ways:
- Increased Thyroid-Binding Globulin (TBG):
- Estrogen stimulates the liver to produce more TBG, which binds to free thyroid hormones (T3 and T4), making them inactive and unavailable for use by cells.
- This can lead to functional hypothyroidism, where thyroid levels appear normal on standard tests, but cellular hypothyroid symptoms (fatigue, weight gain, cold intolerance) persist.
- Disruption of T4 to T3 Conversion:
- High estrogen levels can reduce the conversion of T4 (inactive) into T3 (active thyroid hormone), leading to low T3 levels (the hormone that drives metabolism).
- Instead, more T4 is converted into reverse T3 (rT3), which blocks thyroid function at the cellular level.
- Progesterone Deficiency:
- Progesterone supports thyroid function and metabolism, but in estrogen dominance, progesterone is often low.
- Without enough progesterone, thyroid hormone production and receptor sensitivity decrease, further slowing metabolism.
2. Estrogen, Insulin Resistance & Fat Storage
Excess estrogen affects glucose metabolism and fat storage, leading to unexplained weight gain:
- Increased Fat Storage (Lipogenesis):
- Estrogen stimulates alpha-adrenergic receptors in fat cells, which inhibits fat breakdown (lipolysis), especially in the hips, thighs, and belly.
- It also promotes the activity of lipoprotein lipase (LPL), an enzyme that encourages fat storage, particularly when estrogen is unopposed by progesterone.
- Insulin Resistance:
- Estrogen dominance can increase insulin resistance, making it harder for cells to absorb glucose, leading to higher blood sugar and more fat storage.
- This further slows metabolism and contributes to difficulty losing weight, even with diet and exercise.
3. Estrogen & Cortisol Dysregulation
Estrogen dominance can disrupt the HPA axis, leading to elevated cortisol, which:
- Increases fat storage, particularly in the abdomen.
- Promotes muscle breakdown (catabolism), which lowers resting metabolic rate (RMR).
- Suppresses thyroid function by inhibiting TSH release from the pituitary gland.
4. Inflammation & Gut Health
- Excess estrogen can contribute to gut dysbiosis, leading to leaky gut and chronic inflammation, which further impairs thyroid function and insulin sensitivity.
- Poor estrogen detoxification through the liver (especially Phase II detox via methylation and glucuronidation) leads to the recirculation of estrogen, worsening the imbalance.
Summary
Estrogen dominance contributes to weight gain and low thyroid by:
- Suppressing thyroid function through increased TBG, reduced T3, and higher rT3.
- Promoting fat storage via increased lipogenesis and insulin resistance.
- Raising cortisol levels, which slows metabolism and increases belly fat.
- Increasing inflammation and gut dysfunction, impairing metabolism and estrogen detox.
Addressing estrogen dominance through detoxification (liver support), balancing progesterone, optimizing gut health, and managing insulin/cortisol can help restore metabolic function and facilitate weight loss.
Hormonal Imbalances in Aging Women: Signs & Symptoms Chart
| Hormone | Low Symptoms | High Symptoms |
|---|---|---|
| Estrogen (↓) | Brain fog, memory issues Hot flashes, night sweats Vaginal dryness, painful intercourse Low libido, mood swings Slow metabolism, belly fat Joint pain, dry skin, thinning hair Osteoporosis, increased fracture risk |
Weight gain in hips, thighs, belly Breast tenderness, fibrocystic breasts Heavy, painful periods (if still cycling) Bloating, water retention Mood swings, irritability, anxiety Headaches, migraines Histamine intolerance, sinus issues |
| Progesterone (↓) | Anxiety, poor stress tolerance Insomnia, light sleep Spotting before periods (if cycling) Increased PMS symptoms Water retention, bloating Estrogen dominance symptoms |
Fatigue, low motivation Feeling sluggish or “too calm” Low blood pressure, dizziness Insulin resistance, blood sugar swings Brain fog, slow thinking |
Key Takeaways:
✅ Perimenopause: Often high estrogen + low progesterone, leading to estrogen dominance symptoms.
✅ Menopause: Both estrogen & progesterone decline, causing hot flashes, weight gain, and poor recovery.
✅ Functional Medicine Approach: Supports hormone balance, liver detox, gut health, and stress
Blood chemistry markers can provide valuable clues to liver congestion and overall metabolic dysfunction, which are key in Functional Medicine assessments. When the liver is overburdened (due to poor detoxification, high toxic load, estrogen dominance, or metabolic stress), specific biomarkers can indicate impaired detoxification, sluggish bile flow, inflammation, and oxidative stress.
Key Blood Chemistry Markers for Liver Function & Detoxification
1. Liver Enzymes (AST, ALT, ALP, GGT)
- ALT (Alanine Aminotransferase) (Optimal: 10-25 U/L)
- Elevated ALT suggests liver cell damage, often due to fatty liver, toxicity, or inflammation.
- Low ALT (<10 U/L) can indicate vitamin B6 deficiency, affecting phase 1 liver detox.
- AST (Aspartate Aminotransferase) (Optimal: 10-25 U/L)
- Elevated AST suggests liver stress, but can also indicate muscle breakdown or mitochondrial dysfunction.
- AST/ALT Ratio
- If AST is higher than ALT, consider mitochondrial dysfunction, alcohol-related liver stress, or chronic infections.
- If ALT is higher than AST, it’s more indicative of non-alcoholic fatty liver disease (NAFLD), toxicity, or insulin resistance.
- ALP (Alkaline Phosphatase) (Optimal: 50-90 U/L)
- Elevated ALP may indicate bile stagnation, gallbladder dysfunction, or fat malabsorption.
- Low ALP (<50 U/L) suggests zinc or magnesium deficiency, impairing detox and gut health.
- GGT (Gamma-Glutamyl Transferase) (Optimal: 10-25 U/L)
- One of the best markers for liver congestion, bile flow issues, oxidative stress, and toxicity.
- Elevated GGT is linked to glutathione depletion, often seen in chronic stress, poor detox capacity, and metabolic syndrome.
2. Markers for Bile Flow & Detox Pathways
- Total Bilirubin (Optimal: 0.3-0.8 mg/dL)
- Elevated bilirubin suggests sluggish bile flow, poor liver detox, or hemolysis.
- Gilbert’s Syndrome (genetic) causes naturally higher bilirubin, but if combined with fatigue, liver detox pathways need support.
- Bile Acids (if tested separately)
- Elevated bile acids indicate cholestasis (bile stagnation), liver congestion, or SIBO.
- Poor bile flow impairs fat digestion and toxin elimination, contributing to hormone imbalances (e.g., estrogen dominance).
3. Functional Medicine Markers for Detoxification
- Homocysteine (Optimal: 6-9 µmol/L)
- Elevated homocysteine suggests methylation dysfunction, impairing phase 2 liver detox (key for estrogen clearance).
- Can be linked to MTHFR gene mutations, B12, folate, or B6 deficiencies.
- LDH (Lactate Dehydrogenase) (Optimal: 140-180 U/L)
- Elevated LDH suggests oxidative stress, hypoxia, or poor mitochondrial function, often seen with toxic burden or metabolic dysfunction.
- Ferritin (Optimal: 50-100 ng/mL for women)
- Elevated ferritin (>150 ng/mL) indicates liver stress, inflammation, and oxidative damage (e.g., fatty liver, toxicity, or iron overload).
- Low ferritin (<50 ng/mL) suggests poor iron storage, gut malabsorption, or chronic inflammation.
- Albumin & Total Protein (Albumin Optimal: 4.2-5.0 g/dL)
- Low albumin suggests chronic liver dysfunction, malabsorption, or protein deficiency.
- Low total protein (<6.9 g/dL) indicates poor digestion or low amino acid intake, impairing phase 2 detox (glucuronidation, sulfation, methylation).
4. Blood Sugar & Insulin Markers (Tied to Liver & Detox)
- Fasting Insulin (Optimal: <5 µIU/mL)
- Elevated insulin signals insulin resistance, fatty liver, and metabolic stress, leading to poor detox capacity.
- Fasting Glucose & HbA1c (HbA1c Optimal: 4.8-5.2%)
- Elevated glucose & HbA1c suggest poor blood sugar control, which worsens liver congestion.
- High blood sugar leads to advanced glycation end products (AGEs), increasing oxidative stress in the liver.
5. Inflammatory & Oxidative Stress Markers
- hs-CRP (High-Sensitivity C-Reactive Protein) (Optimal: <1.0 mg/L)
- Elevated hs-CRP suggests systemic inflammation, liver stress, and oxidative damage.
- Fibrinogen (Optimal: 200-300 mg/dL)
- High fibrinogen may indicate poor circulation, sluggish detox, and chronic inflammation.
- Uric Acid (Optimal: 3-5.5 mg/dL)
- Elevated uric acid is linked to poor liver detox, metabolic dysfunction, and oxidative stress.
Putting It Together: Patterns of Liver Congestion
- Liver Enzymes (AST, ALT, GGT) High + High Ferritin + High Uric Acid → Likely fatty liver, oxidative stress, or toxicity overload.
- Elevated Bilirubin + Low ALP + Gut Issues → Sluggish bile flow, estrogen dominance, or impaired detoxification.
- Low Homocysteine + Low Albumin + Low ALT → Poor methylation and phase 2 liver detox, possibly B vitamin deficiency.
- Elevated Insulin + High AST/ALT Ratio + High Triglycerides → Metabolic liver stress (NAFLD, insulin resistance, or SIBO-related toxicity).
Functional Medicine Approach to Liver Detox
- Support Phase 1 & 2 Liver Detox
- Phase 1 (Cytochrome P450): Needs B vitamins, glutathione, and antioxidants.
- Phase 2 (Conjugation Pathways): Needs amino acids (glycine, taurine, glutamine), magnesium, and methylation cofactors.
- Improve Bile Flow & Gut Health
- Use bitter herbs (dandelion, milk thistle, artichoke).
- Optimize choline intake (eggs, liver, phosphatidylcholine).
- Consider ox bile or TUDCA for sluggish bile.
- Reduce Toxic Burden
- Eliminate processed foods, alcohol, plastics (BPA), and endocrine disruptors.
- Enhance sweating (infrared sauna, exercise, Epsom salt baths).
- Stabilize Blood Sugar & Insulin
- Implement time-restricted eating, strength training, and berberine or chromium if needed.
- Address Oxidative Stress & Inflammation
- Curcumin, resveratrol, NAC, alpha-lipoic acid (ALA), and omega-3s help combat oxidative damage.
Final Thoughts
Blood chemistry provides a functional roadmap to uncover hidden liver congestion, sluggish detox pathways, and metabolic imbalances. By analyzing these markers in context, Functional Medicine can target specific areas for improvement and restore optimal detoxification, metabolism, and hormonal balance.
How Estrogen Dominance Leads to Fat Gain: Mechanism of Action
Estrogen dominance occurs when estrogen levels are too high relative to progesterone, even if estrogen itself isn’t excessive. This imbalance can drive fat storage, particularly in the hips, thighs, and belly, through several key mechanisms:
1. Increased Fat Cell Growth & Estrogen Recycling
- Fat cells (adipocytes) produce estrogen through aromatization (conversion of androgens into estrogen).
- More estrogen → More fat storage → More estrogen production, creating a vicious cycle.
- Impaired liver detoxification leads to the recirculation of estrogen, making it harder to clear excess estrogen from the body.
2. Slows Metabolism & Impairs Thyroid Function
- Estrogen dominance increases levels of thyroid-binding globulin (TBG), reducing free T3 & T4 thyroid hormones, leading to hypothyroidism-like symptoms.
- Low thyroid function = slower metabolism, lower energy output, and increased fat storage.
3. Increases Insulin Resistance & Blood Sugar Dysregulation
- High estrogen can disrupt insulin signaling, leading to higher blood sugar and fat storage (especially in the belly).
- Insulin resistance worsens cravings, energy crashes, and difficulty losing weight.
4. Promotes Water Retention & Bloating
- High estrogen leads to higher aldosterone levels, which causes sodium and water retention, leading to bloating and puffiness.
- Progesterone is a natural diuretic, so when it’s too low compared to estrogen, excess fluid stays trapped in tissues.
5. Cortisol Connection: Stress & Fat Storage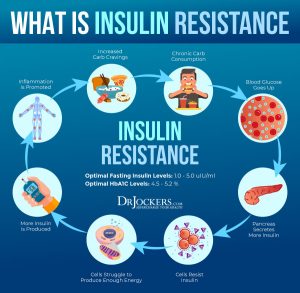
- Estrogen dominance increases stress sensitivity, raising cortisol levels.
- High cortisol = more fat storage in the abdomen (visceral fat).
- Chronic stress also depletes progesterone, worsening estrogen dominance.
Key Takeaways for Fat Loss & Hormone Balance
✅ Support Liver Detox: Prioritize cruciferous vegetables (broccoli, cauliflower, kale), DIM, calcium-D-glucarate.
✅ Balance Blood Sugar: Eat protein + fiber + healthy fats to stabilize insulin.
✅ Lower Stress & Cortisol: Prioritize sleep, adaptogens, breathwork.
✅ Increase Progesterone Naturally: Reduce stress, ensure adequate magnesium, vitamin B6, and zinc.
✅ Exercise Wisely: Strength training + moderate cardio + avoiding chronic high-intensity stressors.
In middle-aged women, the interplay between low progesterone and high estrogen—a state often referred to as estrogen dominance—can significantly contribute to weight gain.
Understanding the mechanisms behind this can provide insights into effective management strategies.


Debbie Potts Blood chemistry Assessment 2023-2025
| Comprehensive Metabolic Panel (CMP) | 23 Results | Jan 24 | January 2025 | Functional Range | |
| Glucose | 92.00 | 90.00 | 93 | 75 – 86 mg/dL | • Insulin Resistance
• Diabetes • Metabolic Syndrome • Vitamin B1 (thiamine) deficiency • Fatty Liver • Liver Congestion • Cortisol Resistance / Adrenal hyperfunction |
| Uric Acid [Male] | 3.5 – 5.9 mg/dL | ||||
| Uric Acid [Female] | 4.10 | 3.70 | 3.8 | 3.0 – 5.5 mg/dL | |
| BUN | 20.00 | 16.00 | 12 | 12 – 17 mg/dL | • Low protein intake
• Malabsorption • Pancreatic insufficiency • Liver dysfunction |
| Creatinine | 0.76 | 0.62 | 0.65 | 0.8 – 1.1 mg/dL | Low =
Muscle atrophy • Lack of physical activity • Inadequate dietary protein or impaired digestion |
| eGFR | 95.00 | 107.00 | 105 | > 90.0 | |
| BUN/Creatinine Ratio | 26.00 | 26.00 | 18 | 10 – 16 | |
| Sodium | 141.00 | 138.00 | 141 | 135 – 142 mmol/L | |
| Potassium | 5.50 | 4.30 | 4.9 | 4.0 – 4.5 mmol/L | • Adrenal hypofunction • Dehydration • Tissue destruction • Metabolic acidosis |
| Chloride | 103.00 | 101.00 | 102 | 100 – 106 mmol/L | |
| Carbon Dioxide (CO2) | 27.00 | 25.00 | 24 | 25 – 28 mmol/L | |
| Calcium | 10.10 | 9.80 | 10.3 | 9.5 – 10.0 mg/dL | |
| Phosphorous | 3.0 – 4.0 mg/dL | ||||
| Protein (Total) | 6.90 | 6.80 | 7.3 | 6.9 – 7.4 g/dL | |
| Albumin | 4.70 | 4.60 | 4.6 | 4.0 – 5.0 g/dL | |
| Globulin | 2.20 | 2.20 | 2.7 | 2.4 – 2.8 g/dL | |
| A/G Ratio | 2.10 | 2.10 | 1.5 – 2.0 | ||
| Bilirubin (Total) | 0.70 | 0.70 | 0.2 – 1.0 mg/dL | ||
| Alk Phosphatase | 54.00 | 61.00 | 79 | 70 – 100 IU/L | IF LOW = Zinc deficiency |
| LDH | 140 – 200 IU/L | ||||
| AST (SGOT) [Male] | 12 – 25 IU/L | ||||
| AST (SGOT) [Female] | 20.00 | 23.00 | 20 | 10 – 20 IU/L | • Dysfunction located outside of the liver and
biliary tree • Developing congestive heart failure • Cardiovascular dysfunction • Liver cell damage / Liver dysfunction • Excess muscle breakdown or turnover • Viral infections (EBV, CMV, Hepatitis) • Vitamin E deficiency • Alcoholism • Celiac Disease / Crohn’s / Ulcerative Colitis • Certain medications (pain, antibiotics, statins, etc) |
| ALT (SGPT) [Male] | 12 – 28 IU/L | ||||
| ALT (SGPT) [Female] | 19.00 | 36.00 | 26 | 10 – 25 IU/L | Dysfunction located in the liver • Fatty liver • Liver cell damage • Cirrhosis of the liver • Alcoholism • Biliary tract obstruction • Excessive muscle breakdown or turnover • Viral infections (EBV, CMV, Hepatitis) • Celiac Disease / Crohn’s / Ulcerative Colitis • Certain medications (pain, antibiotics, statins, etc) |
| GGT (GGPT) | 18 – 28 IU/L | ||||
| Lipid Panel | Results | Jan 24 | Functional Range | ||
| Cholesterol | 237.00 | 275.00 | 246 | 170 – 200 mg/dL | HIGH =
• Hypothyroidism • Chronic bacterial and viral infections (especially H pylori) • Adrenal cortical dysfunction • Cardiovascular disease / Atherosclerosis • Biliary stasis / Fatty liver • Insulin resistance • Poor metabolism and utilization of fats • Early stage hyperglycemia/Diabetes/Metabolic Syndrome |
| Triglycerides | 64.00 | 57.00 | 50 | 70 – 80 mg/dL | LOW =
• Liver/biliary dysfunction • Hyperthyroidism (or excess thyroid medication) • Autoimmune disorders • Adrenal hyperfunction |
| HDL Cholesterol | 107.00 | 127.00 | 134 | 55 – 85 mg/dL | HIGH =
Autoimmune disorder |
| LDL Cholesterol | 119.00 | 139.00 | 104 | 80 – 100 mg/dL | HIGH =
• Diet high in refined carbohydrates • Metabolic Syndrome • Atherosclerosis • Hyperlipidemia / Fatty Liver • Oxidative stress • Hypothyroidism • H pylori infection |
| Triglycerides/HDL Ratio | 0.60 | 0 – 2 | |||
| Total Cholesterol/HDL Ratio | 2.21 | 0 – 4.4 | |||
| APO1 | 272.00 | 116-209 | |||
| APOB | 89 | 73 | <90 | ||
| Complete Blood Count (CBC) | Results | Jan 24 | Jan 2025 | Functional Range | |
| WBC | 6.20 | 4.30 | 5.4 | 5.0 – 7.5 x10³/µL | |
| RBC [Male] | 4.2 – 4.9 x10⁶/µL | ||||
| RBC [Female] | 4.49 | 4.71 | 4.81 | 3.9 – 4.5 x10⁶/µL | • Respiratory distress (asthma, emphysema) • Polycythemia (relative or absolute) • Dehydration |
| Hemoglobin [Male] | 14.0 – 15.0 g/dL | ||||
| Hemoglobin [Female] | 13.50 | 14.30 | 14.6 | 13.5 – 14.5 g/dL | • Respiratory distress (asthma, emphysema) • Polycythemia (relative or absolute) • Dehydration |
| Hematocrit [Male] | 40 – 48% | ||||
| Hematocrit [Female] | 41.70 | 43.30 | 44.2 | 37 – 44% | |
| MCV | 93.00 | 92.00 | 92 | 82.0 – 89.9 fL | HIGH
• B12/Folate deficiency anemia • Vitamin C deficiency |
| MCH | 30.10 | 30.40 | 30.4 | 28.0 – 31.9 pg | |
| MCHC | 32.40 | 33.00 | 33 | 32 – 35 g/dL | |
| RDW | 12.10 | 11.60 | 12 | 11 – 13% | |
| Platelets | 332.00 | 298.00 | 346 | 150 – 385 x103/µL | |
| Neutrophils | 62.00 | 49.00 | 53 | 40 – 60% | |
| Lymphocytes | 23.00 | 33.00 | 29 | 24 – 44% | |
| Monocytes | 8.00 | 8.00 | 9 | 0 – 7% | • Recovery phase of infection • Liver dysfunction • Intestinal parasites • Tissue inflammation / Gut inflammation • Benign Prostatic Hypertrophy (BPH) |
| Eosinophils | 6.00 | 9.00 | 7 | 0 – 3% | REALLY HIGH =
• Intestinal parasites • Food and environmental allergies/sensitivities • Asthma
|
| Basophils | 1.00 | 1.00 | 2 | 0 – 1% | |
| Iron Panel | Results | Jan 24 | Jan 2025 | Functional Range | |
| Iron (Serum) | 145.00 | 85 – 130 µg/dL | |||
| TIBC | 265.00 | 250 – 350 µg/dL | |||
| Iron Saturation | 46.00 | 25 – 35% | |||
| Ferritin | 36.00 | 61.00 | 62 | 50 – 100 ng/mL | Normal |
| Thyroid Panel | Results | Jan 24 | Functional Range | ||
| TSH | 2.07 | 2.14 | 2.44 | 0.5 – 2.0 µIU/mL | • Primary hypothyroidism
Primary Hypothyroidism (↑ TSH >3.5, ↓ Total T4 , ↓T3, ↓ Free T4 <3.0)
It’s common to see ↑ lipid markers (cholesterol) with hypothyroidism
|
| Total T4 | 5.70 | 6.0 – 11.9 µg/dL | |||
| Free T4 | 1.20 | 1.21 | 1.4 – 1.8 ng/dL | • Primary hypothyroidism • Iodine deficiency | |
| Total T3 | 80.00 | 120 – 180 ng/dL | |||
| Free T3 (bioactive) | 2.40 | 2.5 | 3.4 – 4.4 pg/mL | Hyperthyroidism • Hashimoto’s • Iodine deficiency | |
| T3 Uptake | 25.00 | 28 – 38% | |||
| Reverse T3 | 13.60 | 14.1 | < 15 ng/dL | • High Stress • Trauma • Heavy Metal Toxicity • Low Calorie Diet • Infection • Inflammation • Liver/Kidney dysfunction • Certain medications • Nutrient deficiencies (iron, selenium) | |
| TPO Antibody (Thyroid Peroxidase Ab) | 1.00 | < 10 IU/mL | |||
| TBG Antibody (Thyroglobulin Ab) | 8.00 | < 20 IU/mL | |||
| TT3/RT3 Ratio | 10 – 14 | ||||
| Free T3/RT3 Ratio | 20 – 30 | 2.5 FT3/14.1 RT3 = 5.64
T3 is the “accelerator” and Reverse T3 is the “brakes” |
|||
| v Adrenal Profile (cortisol)
v GI Pathogen Stool Analysis (pathogens, dysbiosis) v OAT Test (bacterial & yeast markers, detox markers) v SpectraCell Micronutrient Test (selenium, zinc) v Iodine Test v Environmental Toxic Chemical Exposure Test v v Heavy Metal Toxicity Test |
|||||
| Additional Markers | Results | Jan 24 | Jan 2025 | Functional Range | |
| Vitamin D | 52.20 | 43.20 | 40.9 | 60 – 80 ng/mL | LOW =
• Poor immune function • Cardiovascular disease • Cancer • Diabetes • Autoimmune disorders • Rickets / Osteoporosis / Tooth decay • Reproductive system disorders |
| Insulin | 4.30 | 3.1 | 1 – 5 µIU/mL | ||
| Hemoglobin A1C | 5.60 | 5.70 | 5.6 | 4.5 – 5.5 % | HIGH =
• Metabolic Syndrome • Pre-Diabetes • Diabetes
|
| Homocysteine | 11.10 | 8.50 | 7.2 | 6.0 – 7.2 umol/L | HIGH =
• Heart disease • Stroke • Alzheimer’s disease • Depression & mood disorders • Nutrient deficiencies (Folate, Vit B6, Vit B12) • MTHFR or BHMT “SNP” (mutation)
B12/Folate Deficiency (↑ MCV, ↑ MCH, ↑ RDW, ↑ MCHC, ↑ LDH)
§ Vit B6 deficiency (↓ ALT, ↓ GGT, ↑ Homocysteine)
|
| Histamine (Whole Blood) | 40 – 70 ng/mL | ||||
| Hs-CRP [Male] | < 0.55 mg/L | ||||
| Hs-CRP [Female] | 0.15 | 0.15 | 0.15 | < 1.5 mg/L | |
| PSA [Male] | 0 – 2.6 ng/mL | ||||
| Fibrinogen | 200 – 300 mg/dL | ||||
| Anion Gap | 7 – 12 mEq/L | ||||
| Magnesium (RBC) | 2.00 | 6.0 – 6.5 mg/dL | |||
| Vitamin B12 (serum) | 989.00 | 777.00 | 812 | 800 – 900 pg/mL | |
| Estrogen Total serum | 45 | ||||
| Progesterone serum | 0.4 | 0.2 | 0.4 | LOW | |
| Testosterone serum | 24 | ||||
| Copper (serum) – 50 | |||||
| Folates | 6.3 | 7.5 | 12-25 | LOW | |
| Cortisol | 16.6 | 15.3 | |||
| Estradiol | 19.2 | 288 |